
Jobs
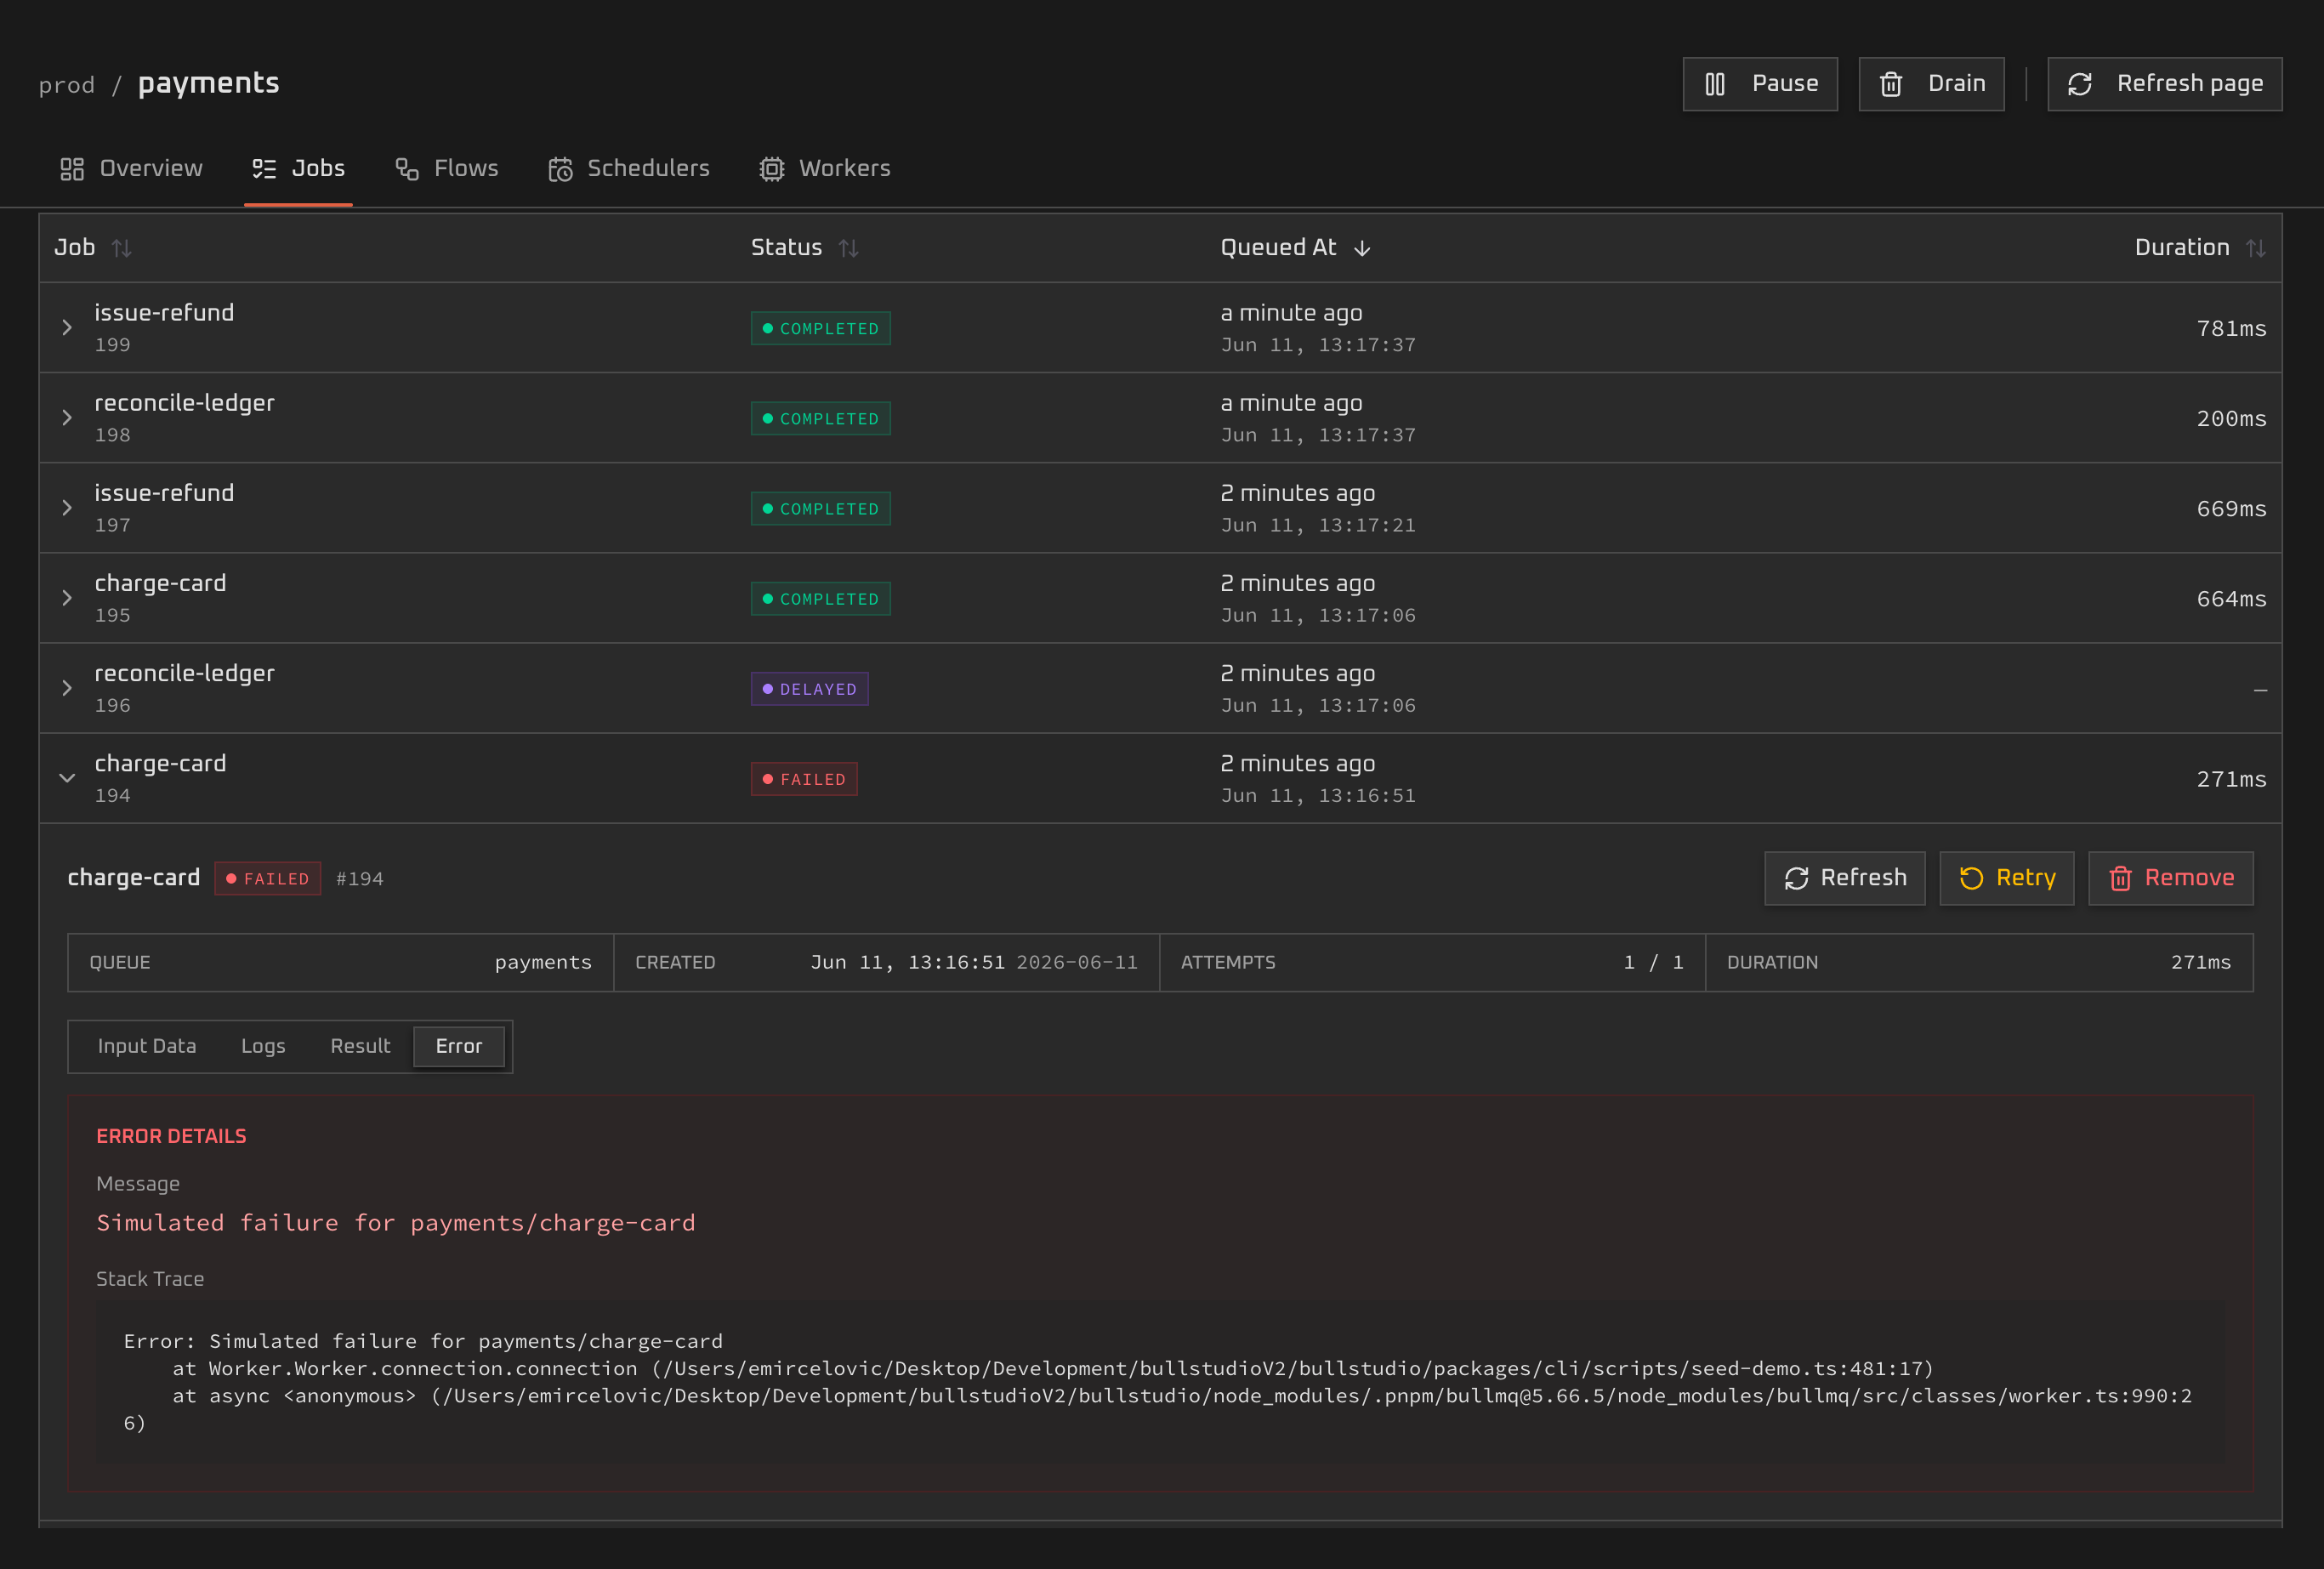
Browse every job by state, search by name or id, and open one to inspect its payload, logs, return value and stack trace. Retry, promote or remove without a Redis CLI.
A modern, performant dashboard for Bull and BullMQ. Inspect and manage queues, jobs and flows directly from your app. Proudly open-source.
npx bullstudio -r redis://localhost:6379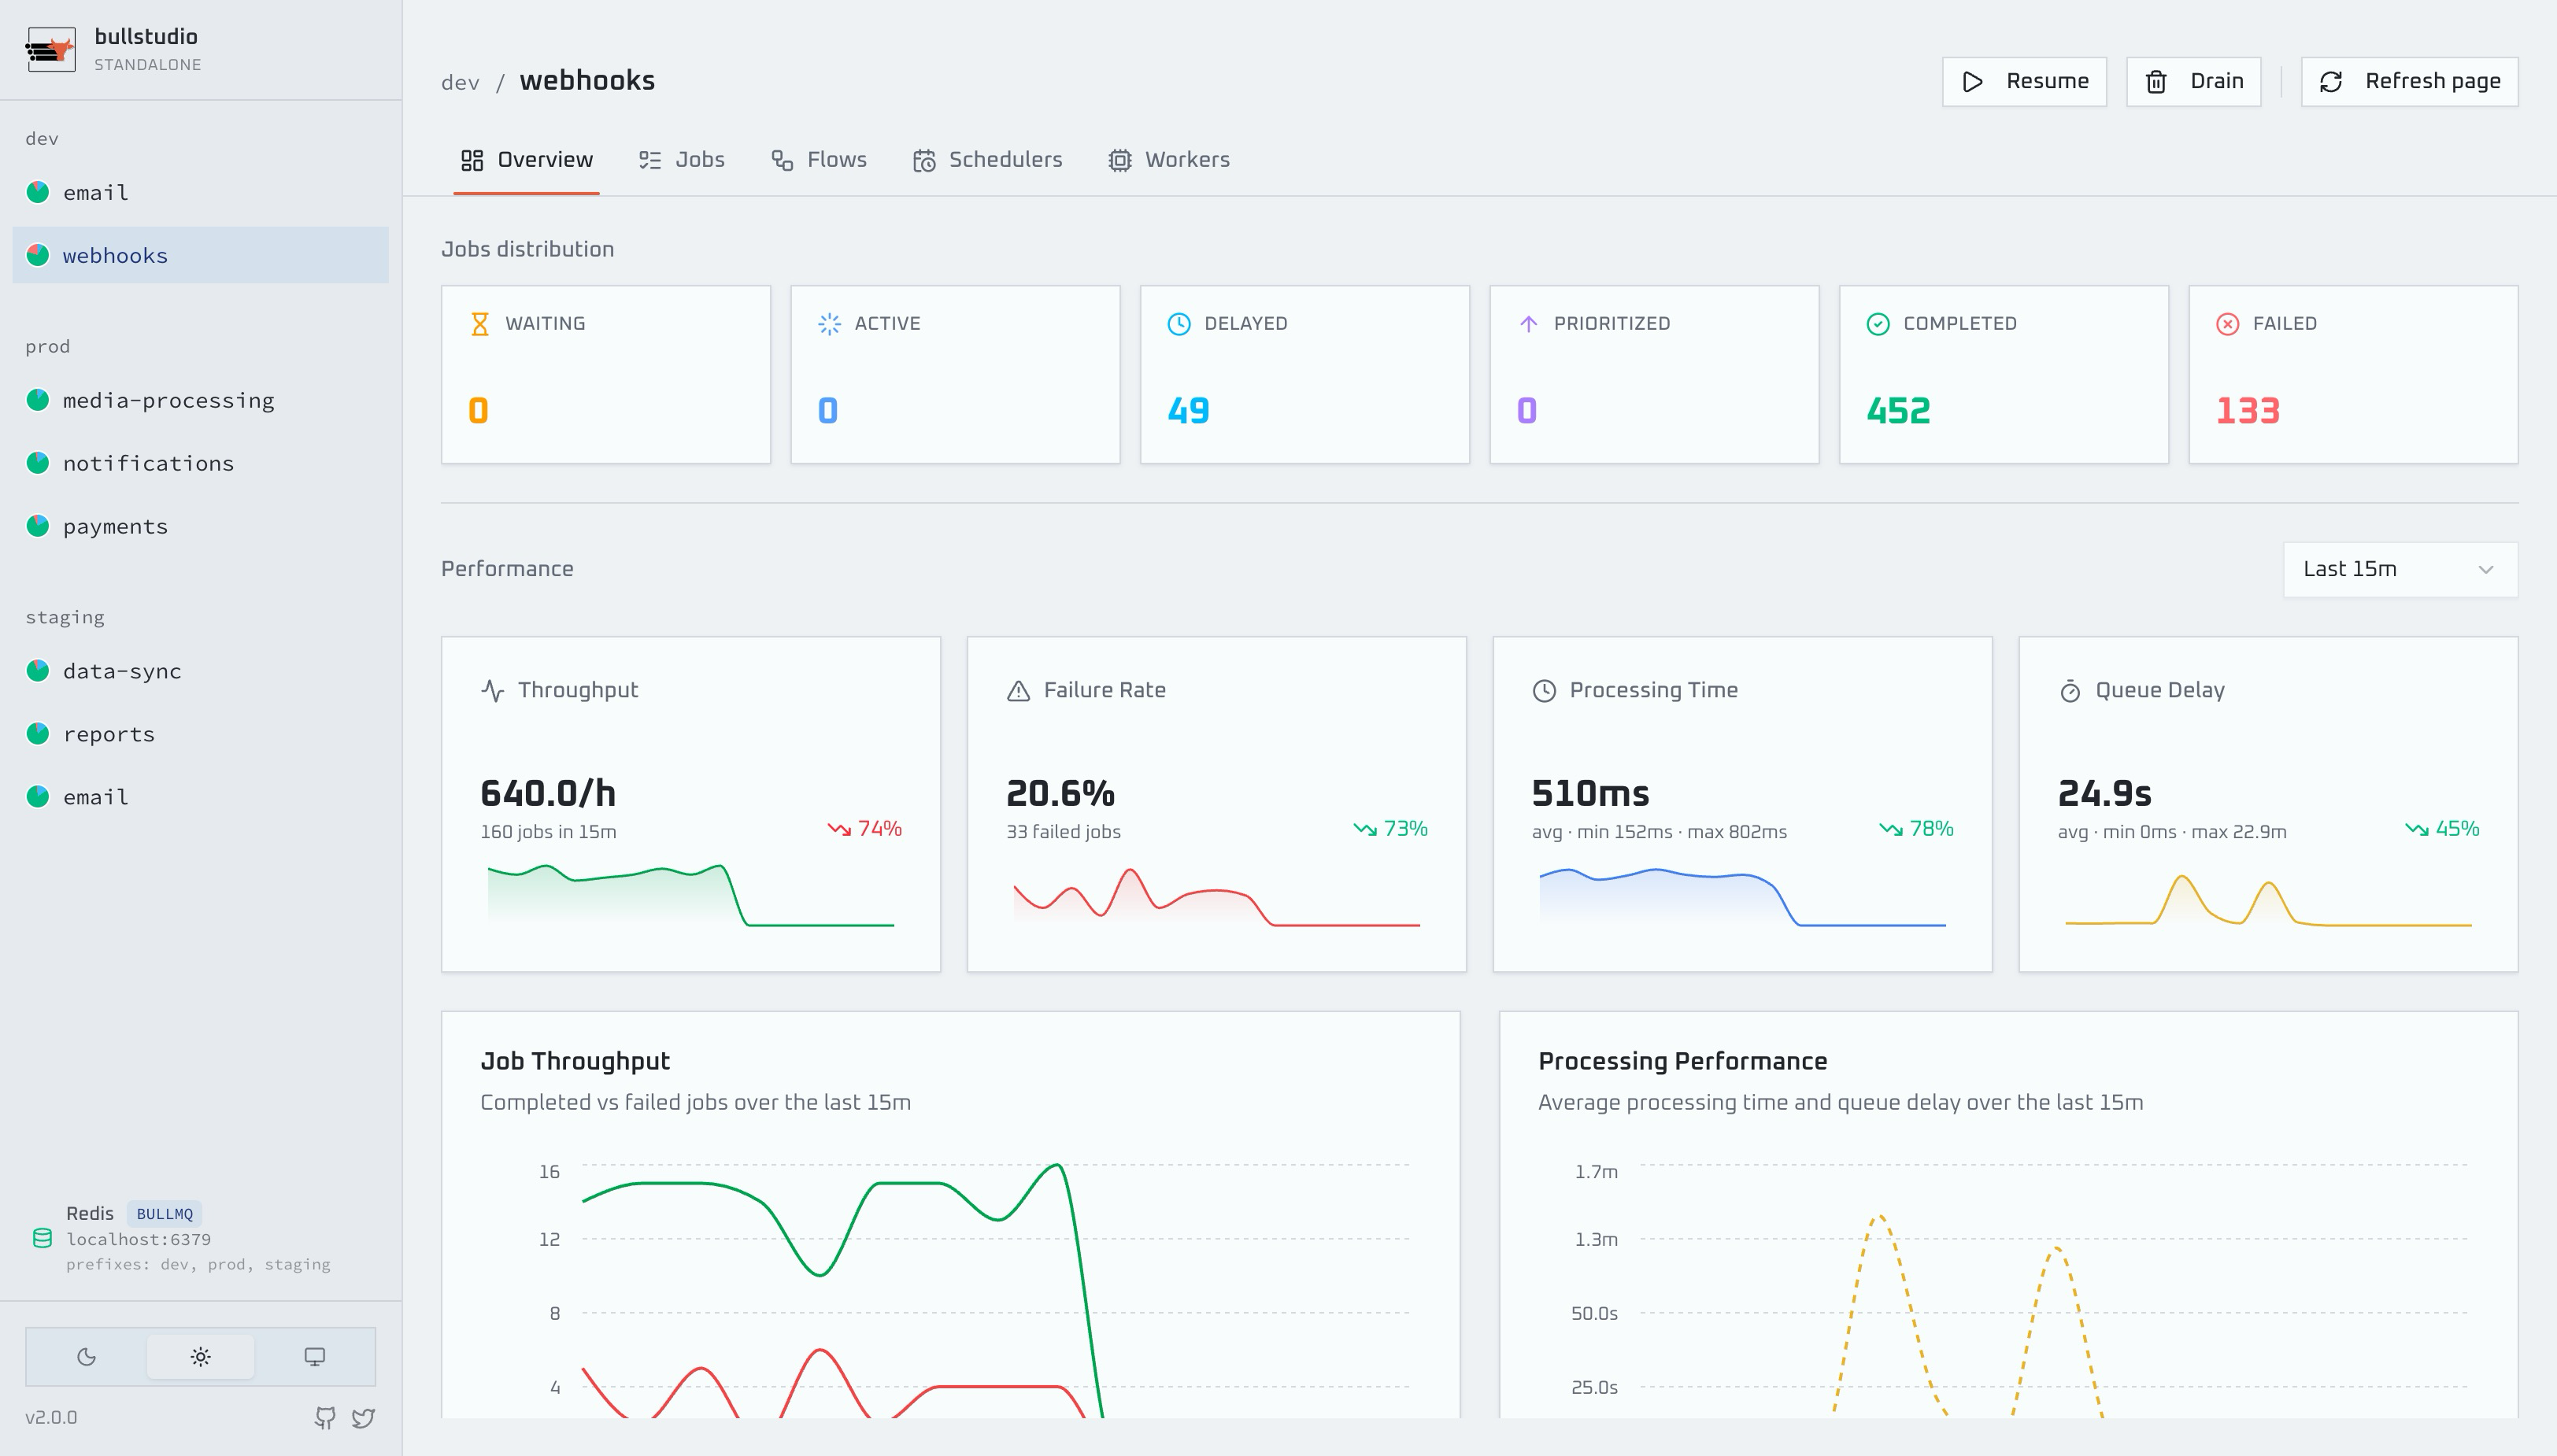
Every surface in Bullstudio is built to answer one question fast: what is happening in this queue right now?
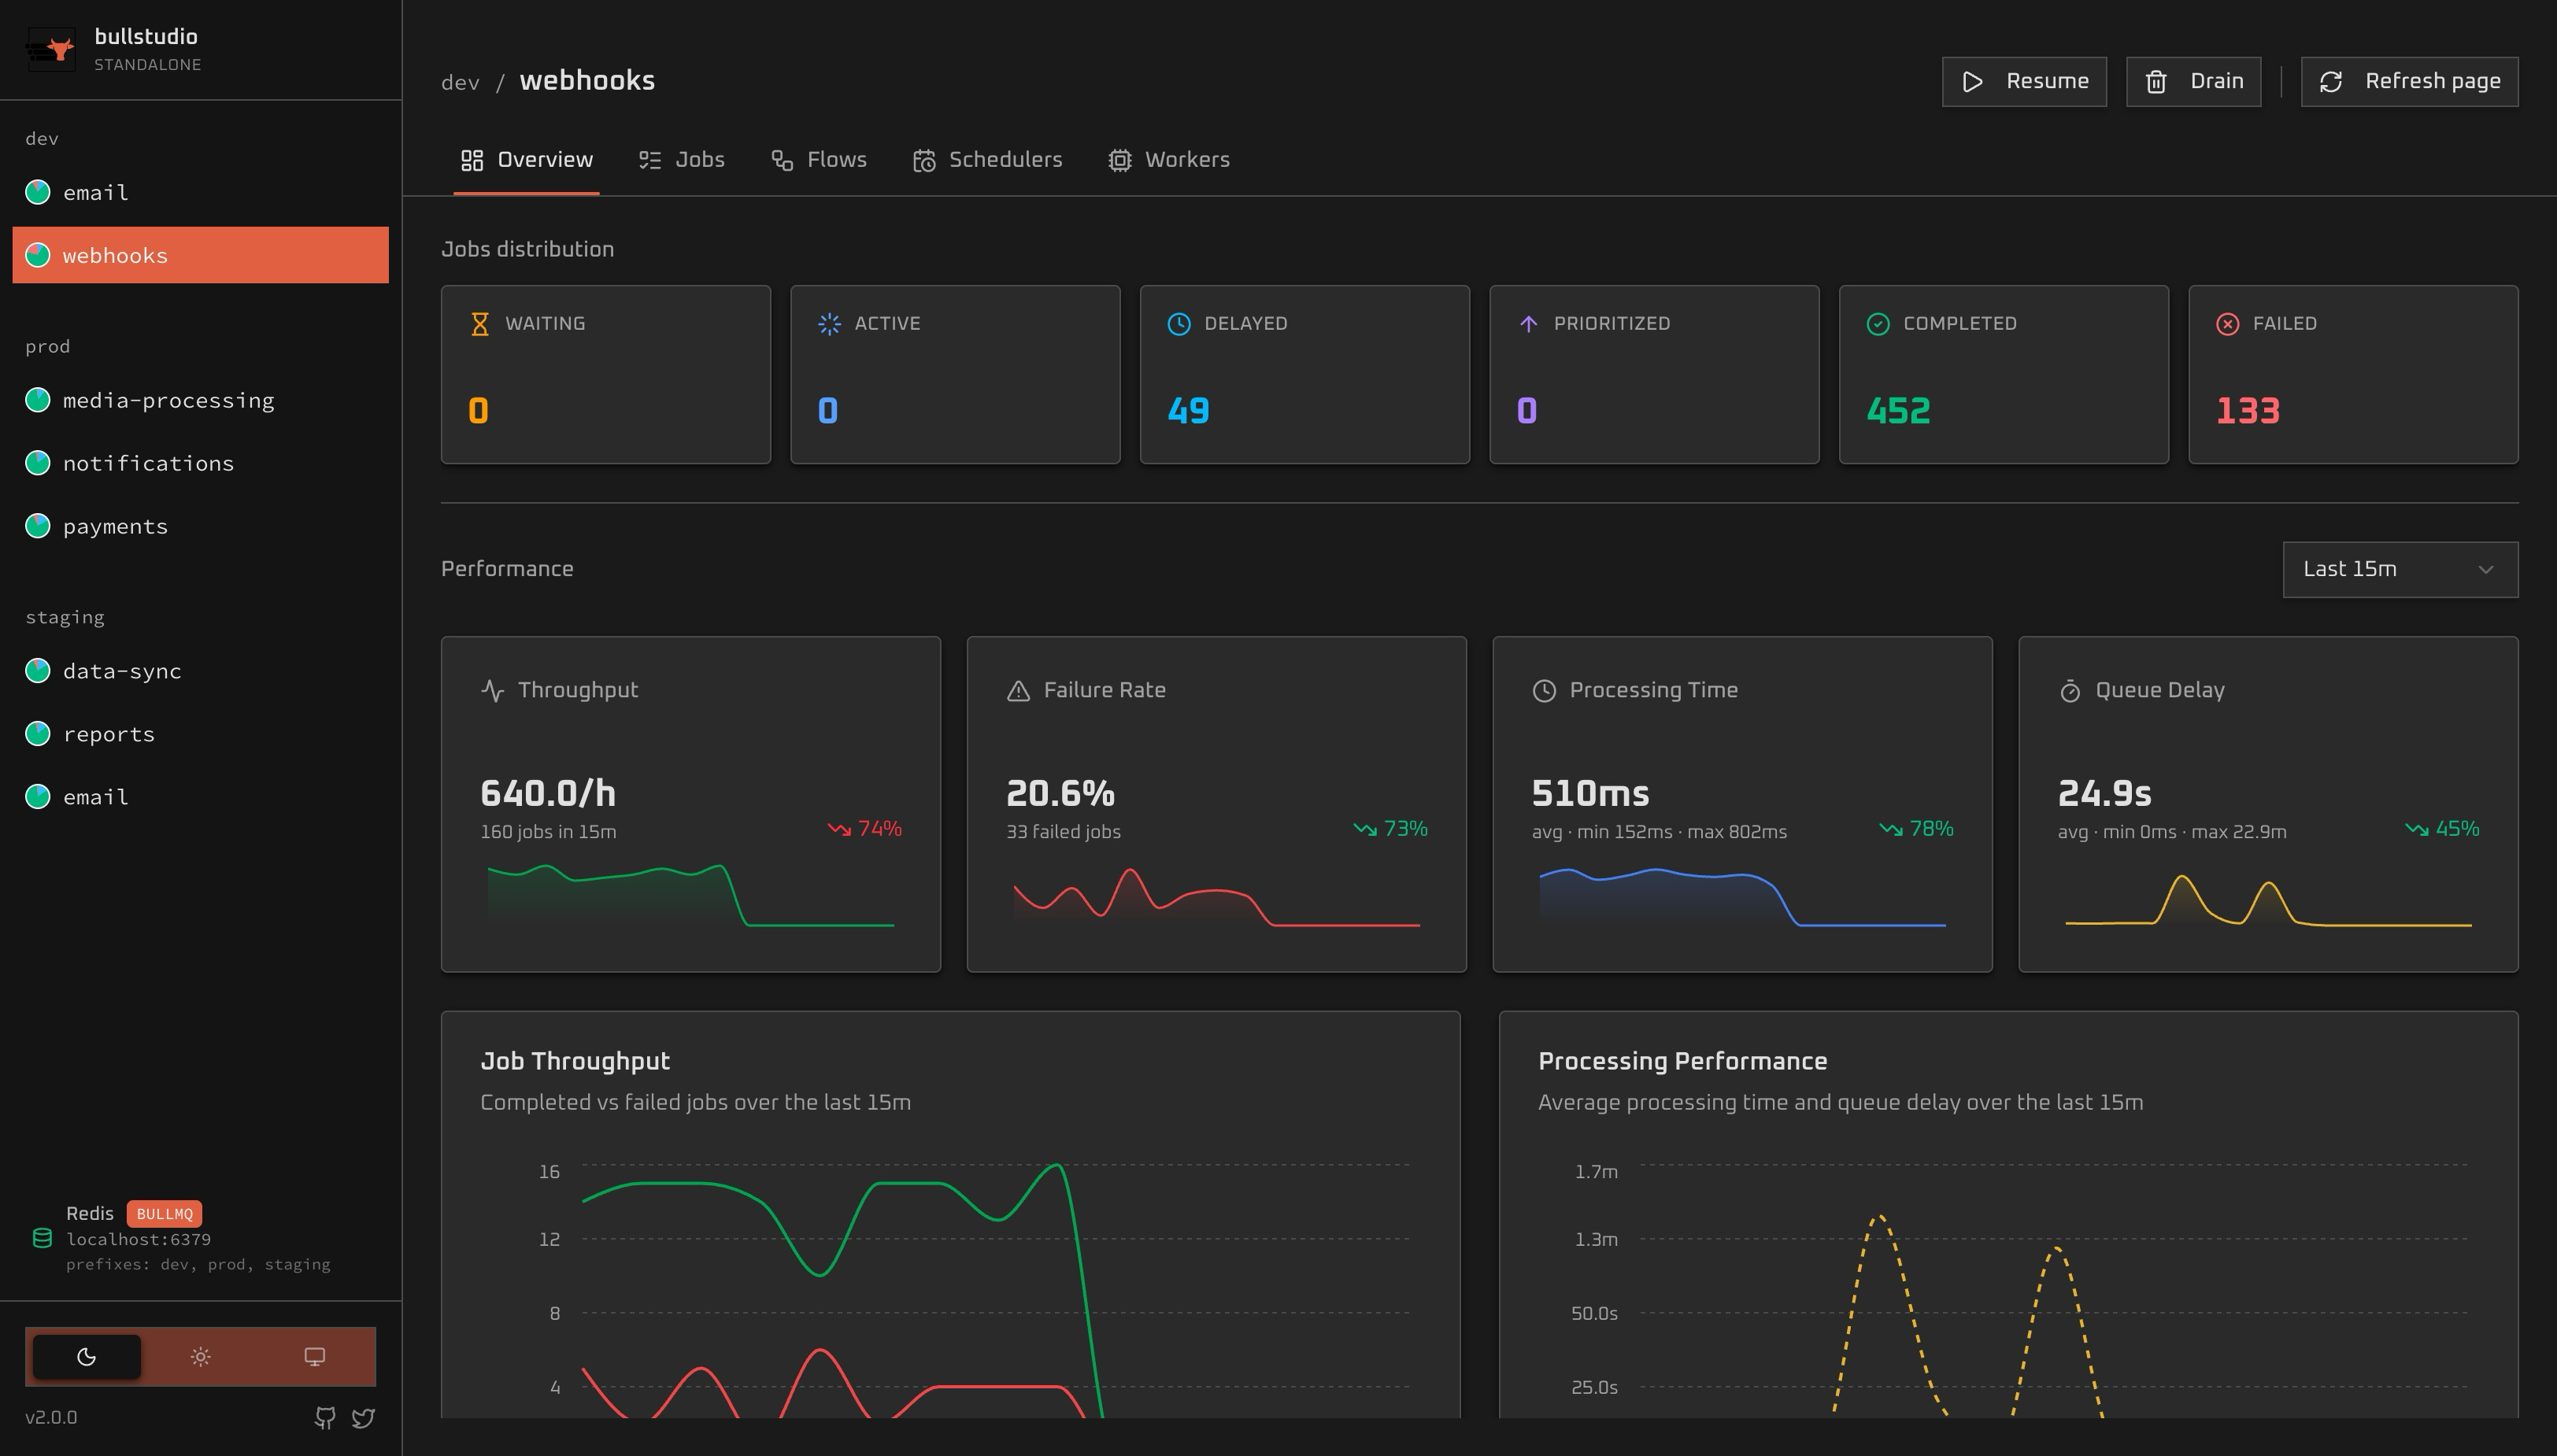
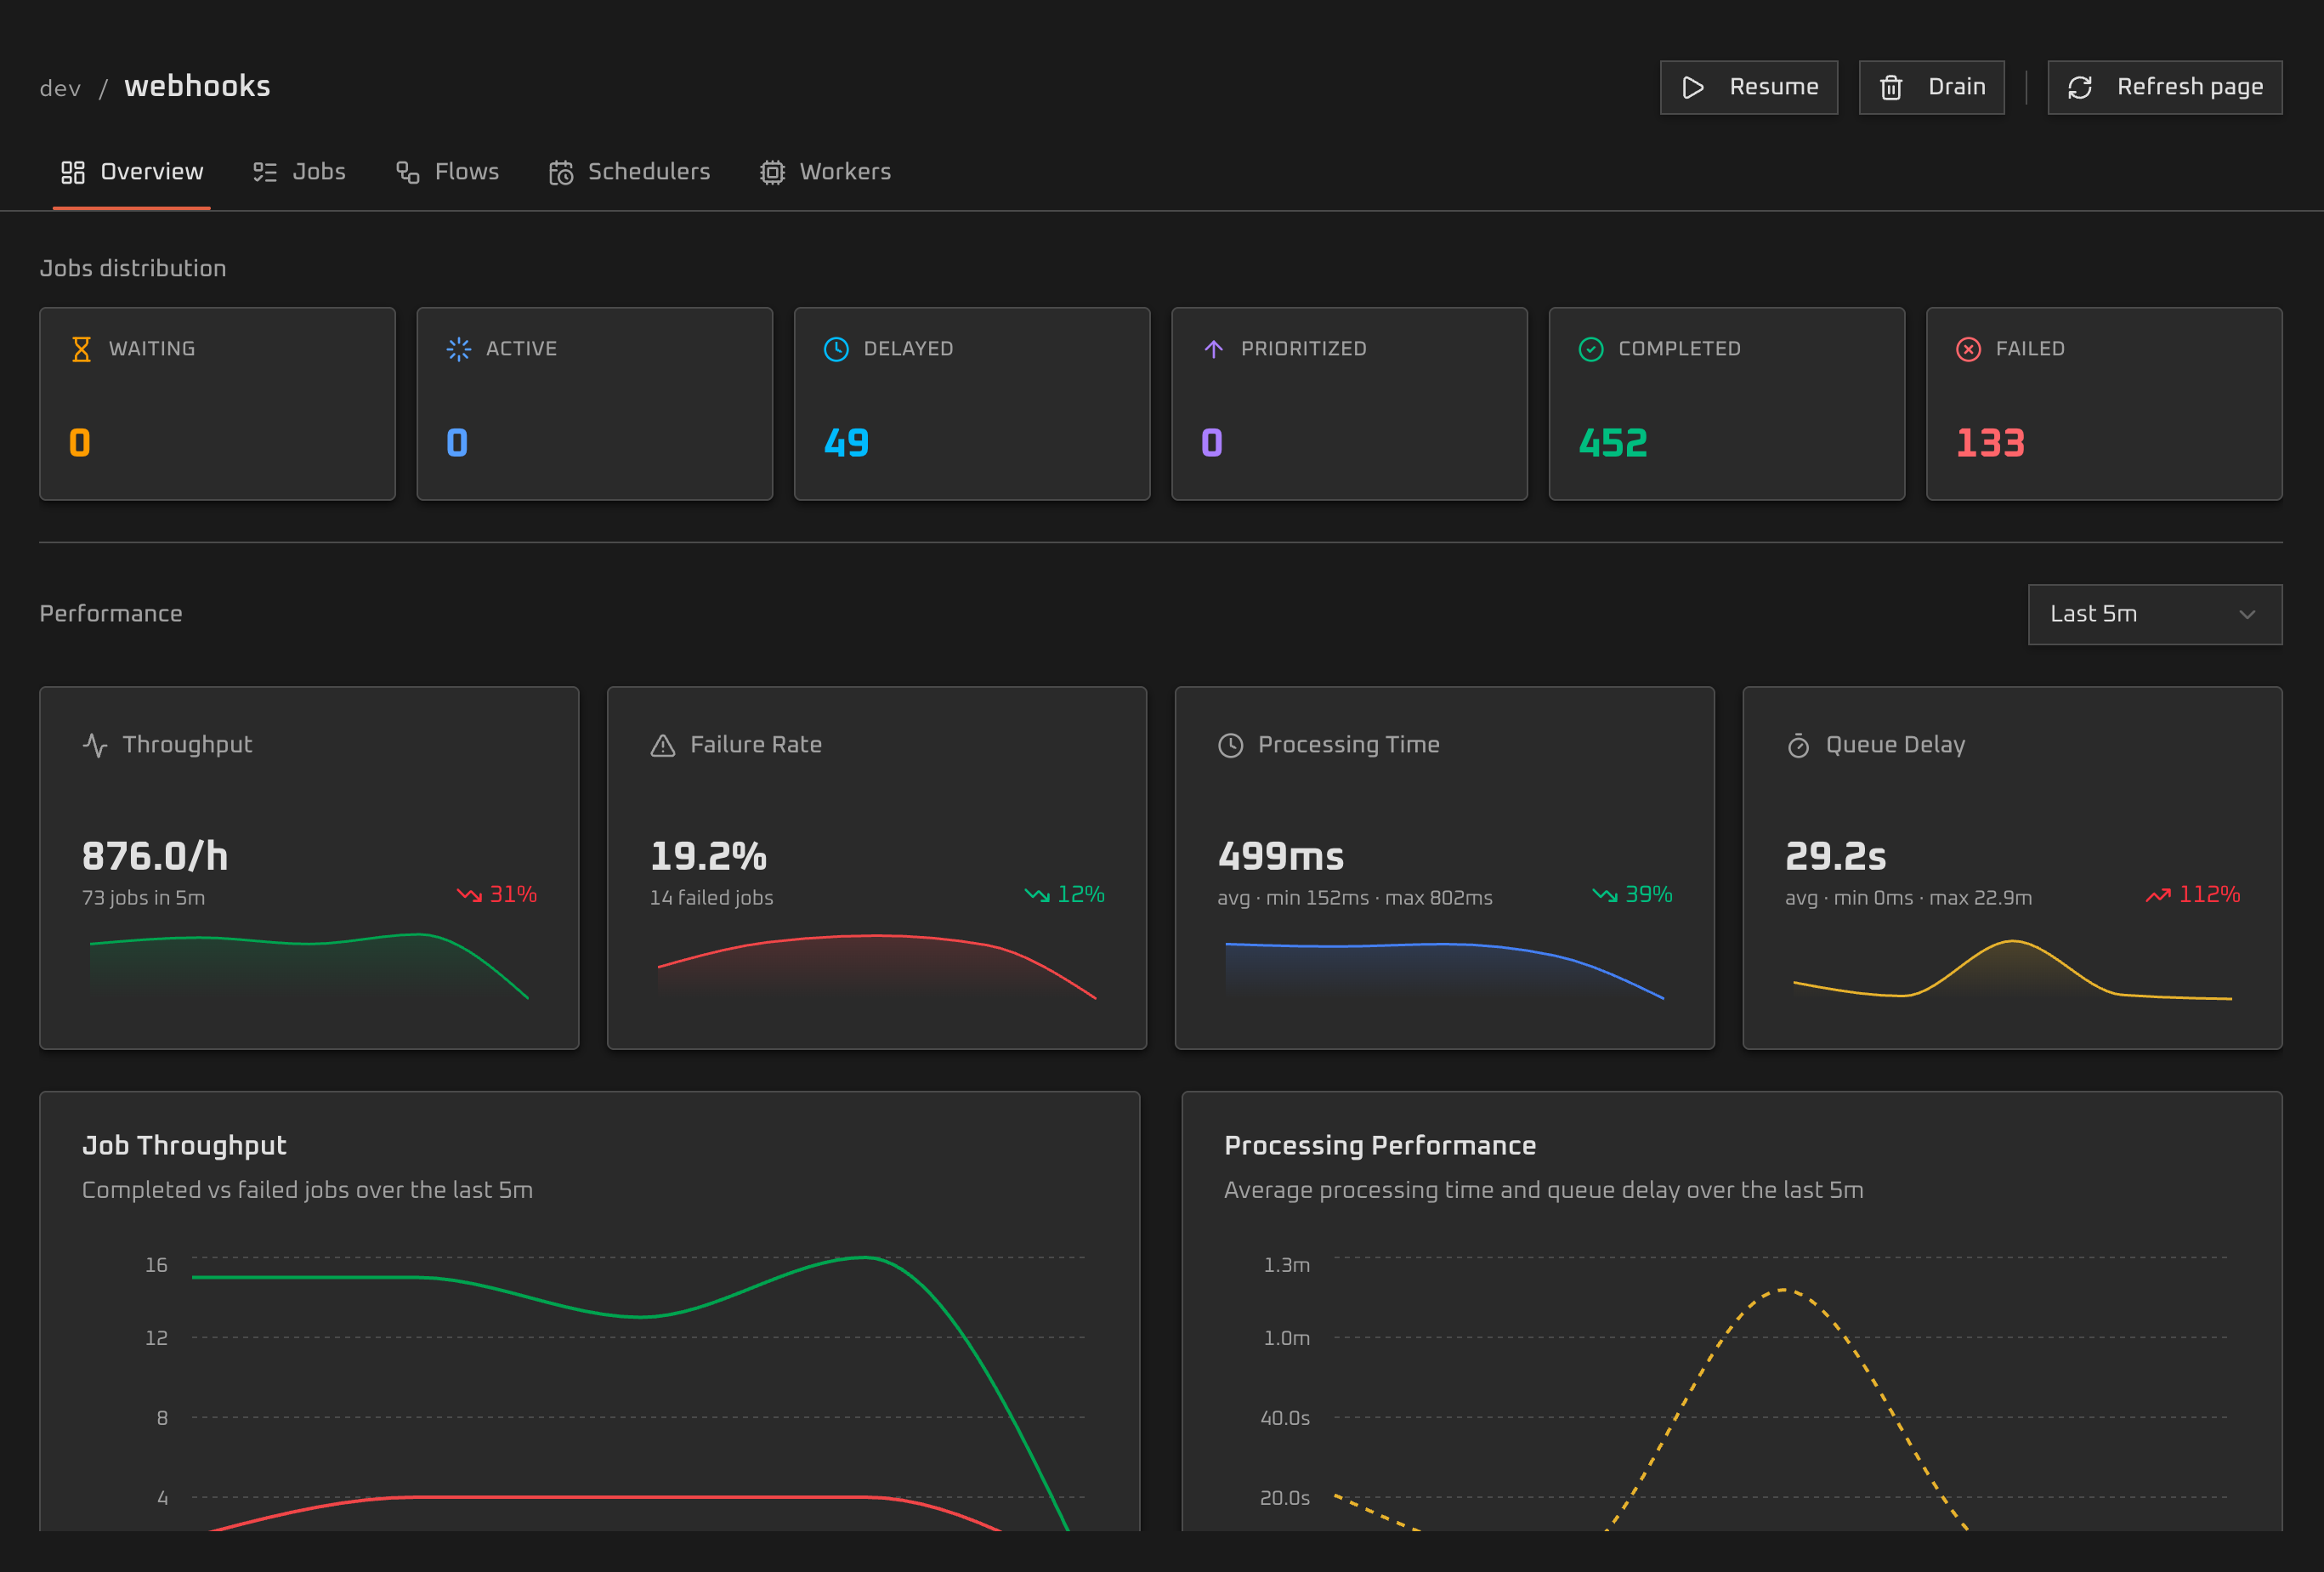
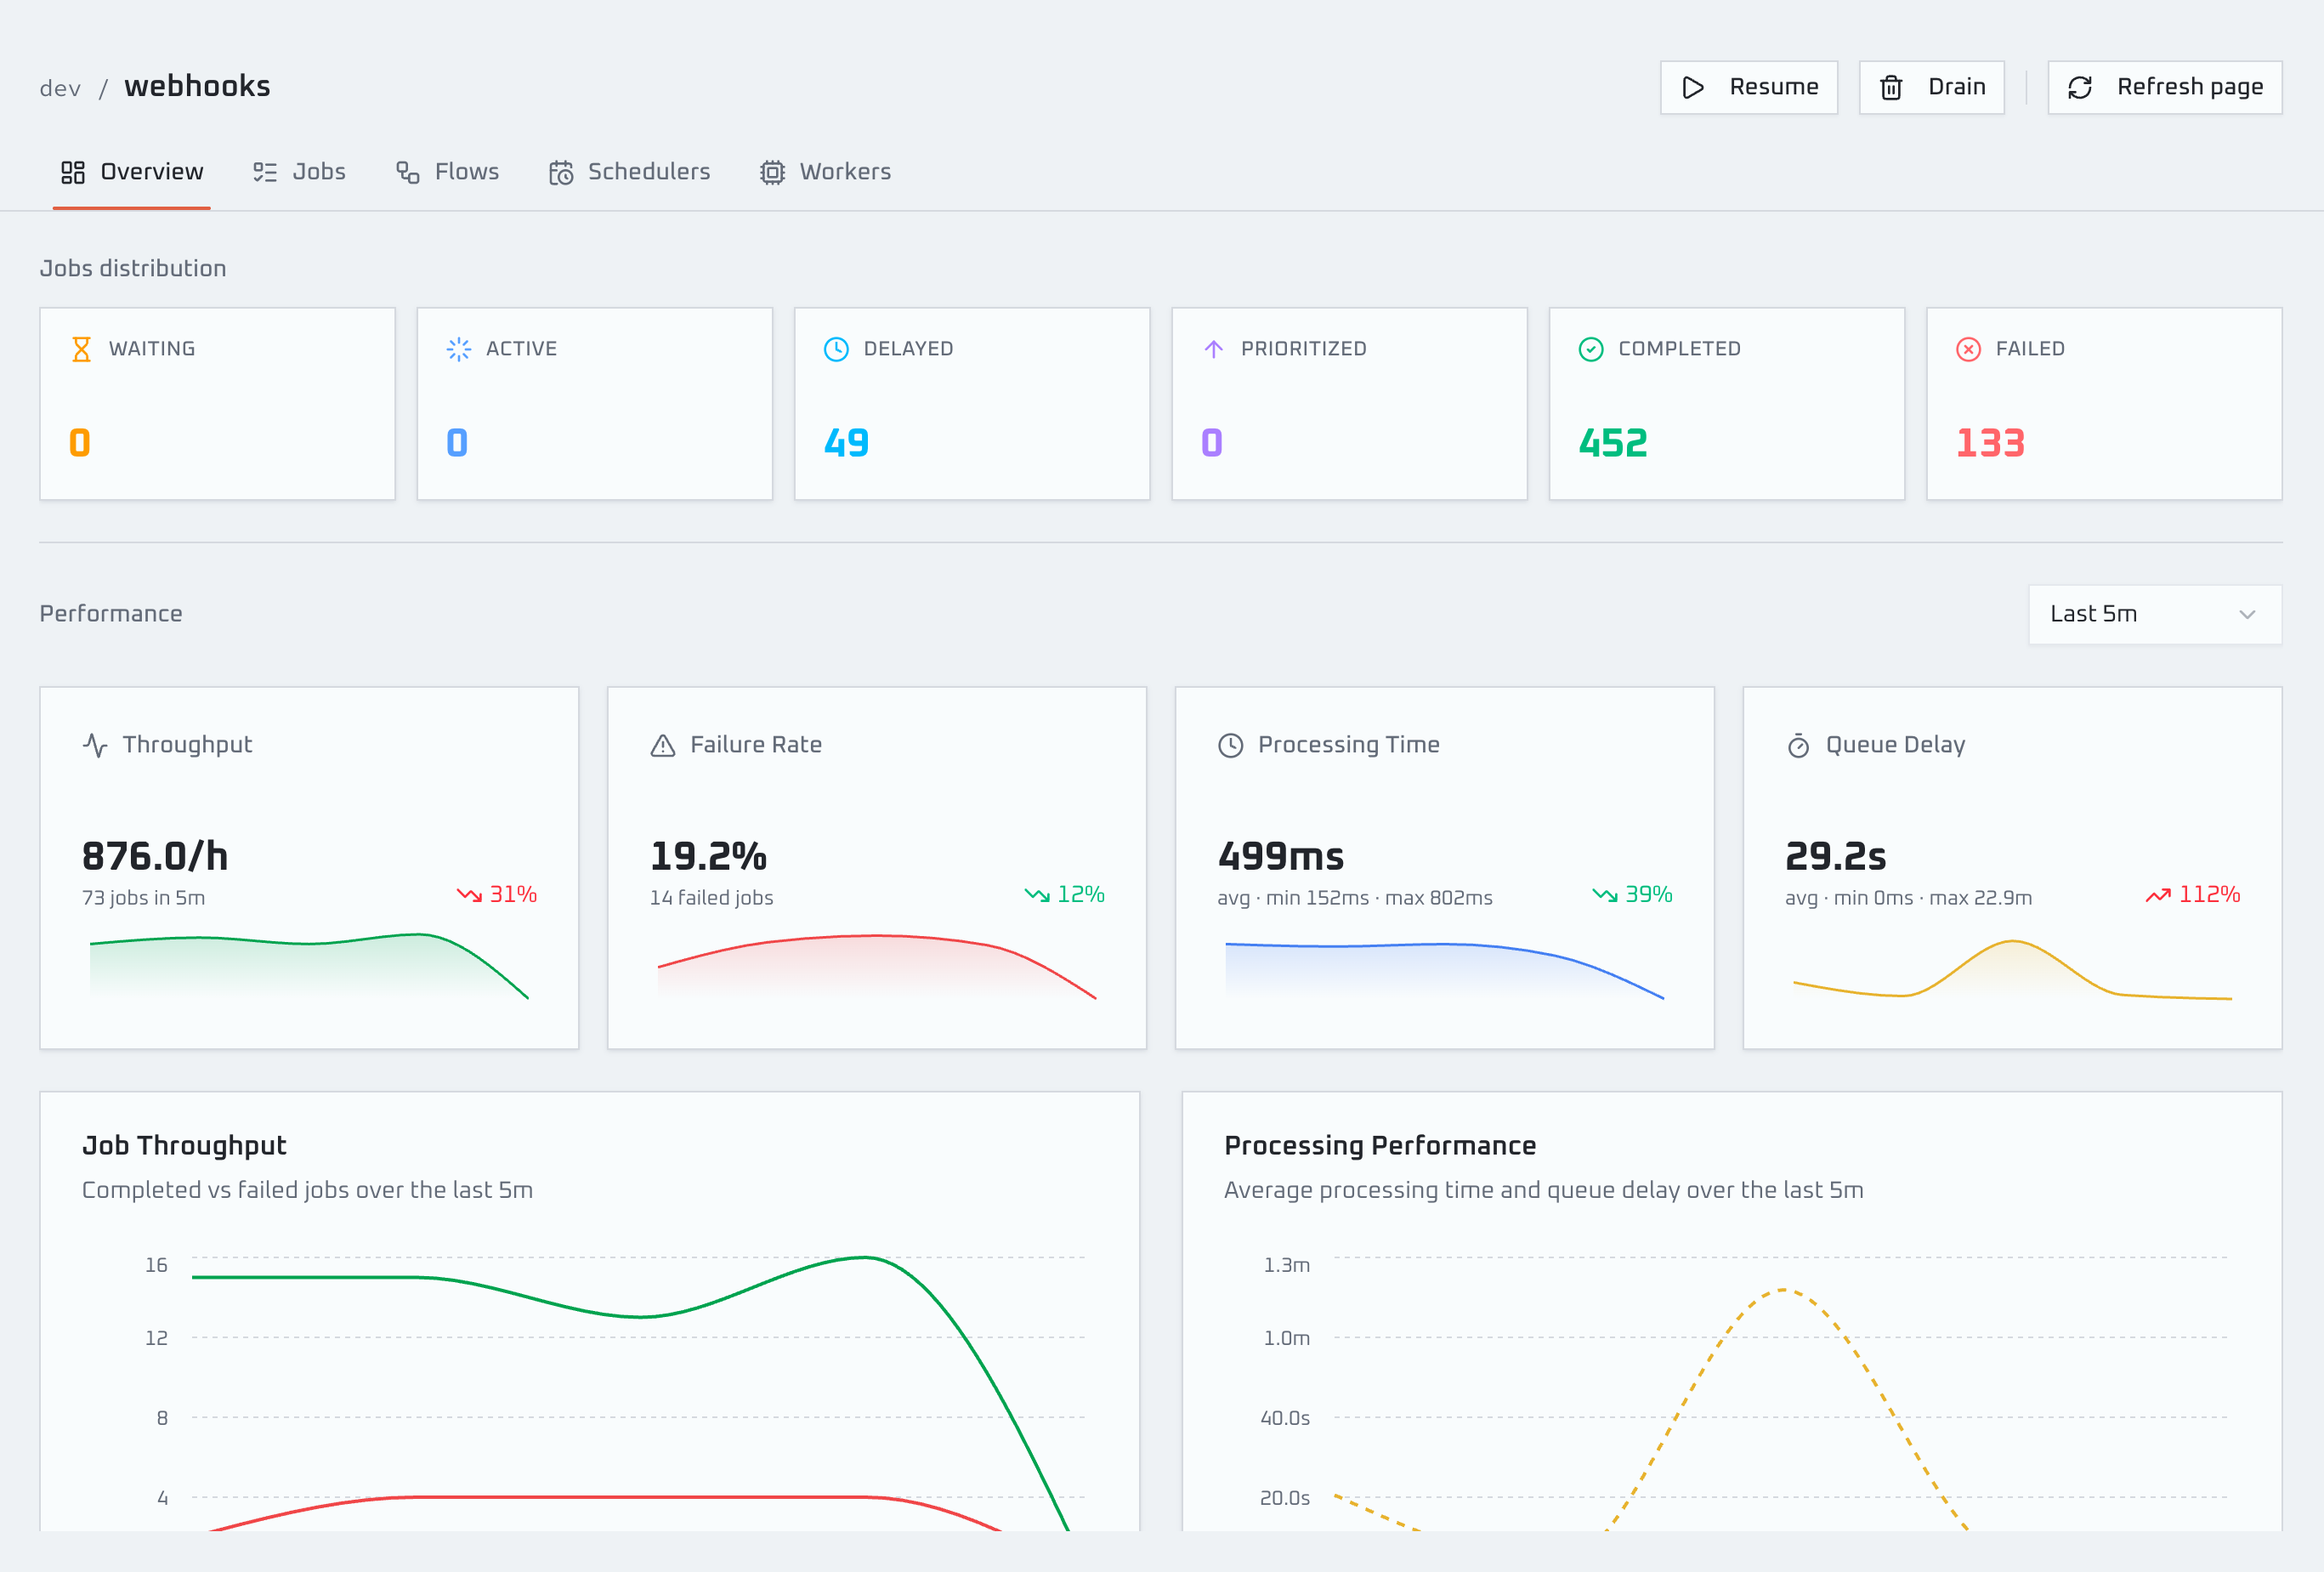
Throughput, failure rate, processing time and backlog across every queue — so you spot trouble before someone files a ticket.
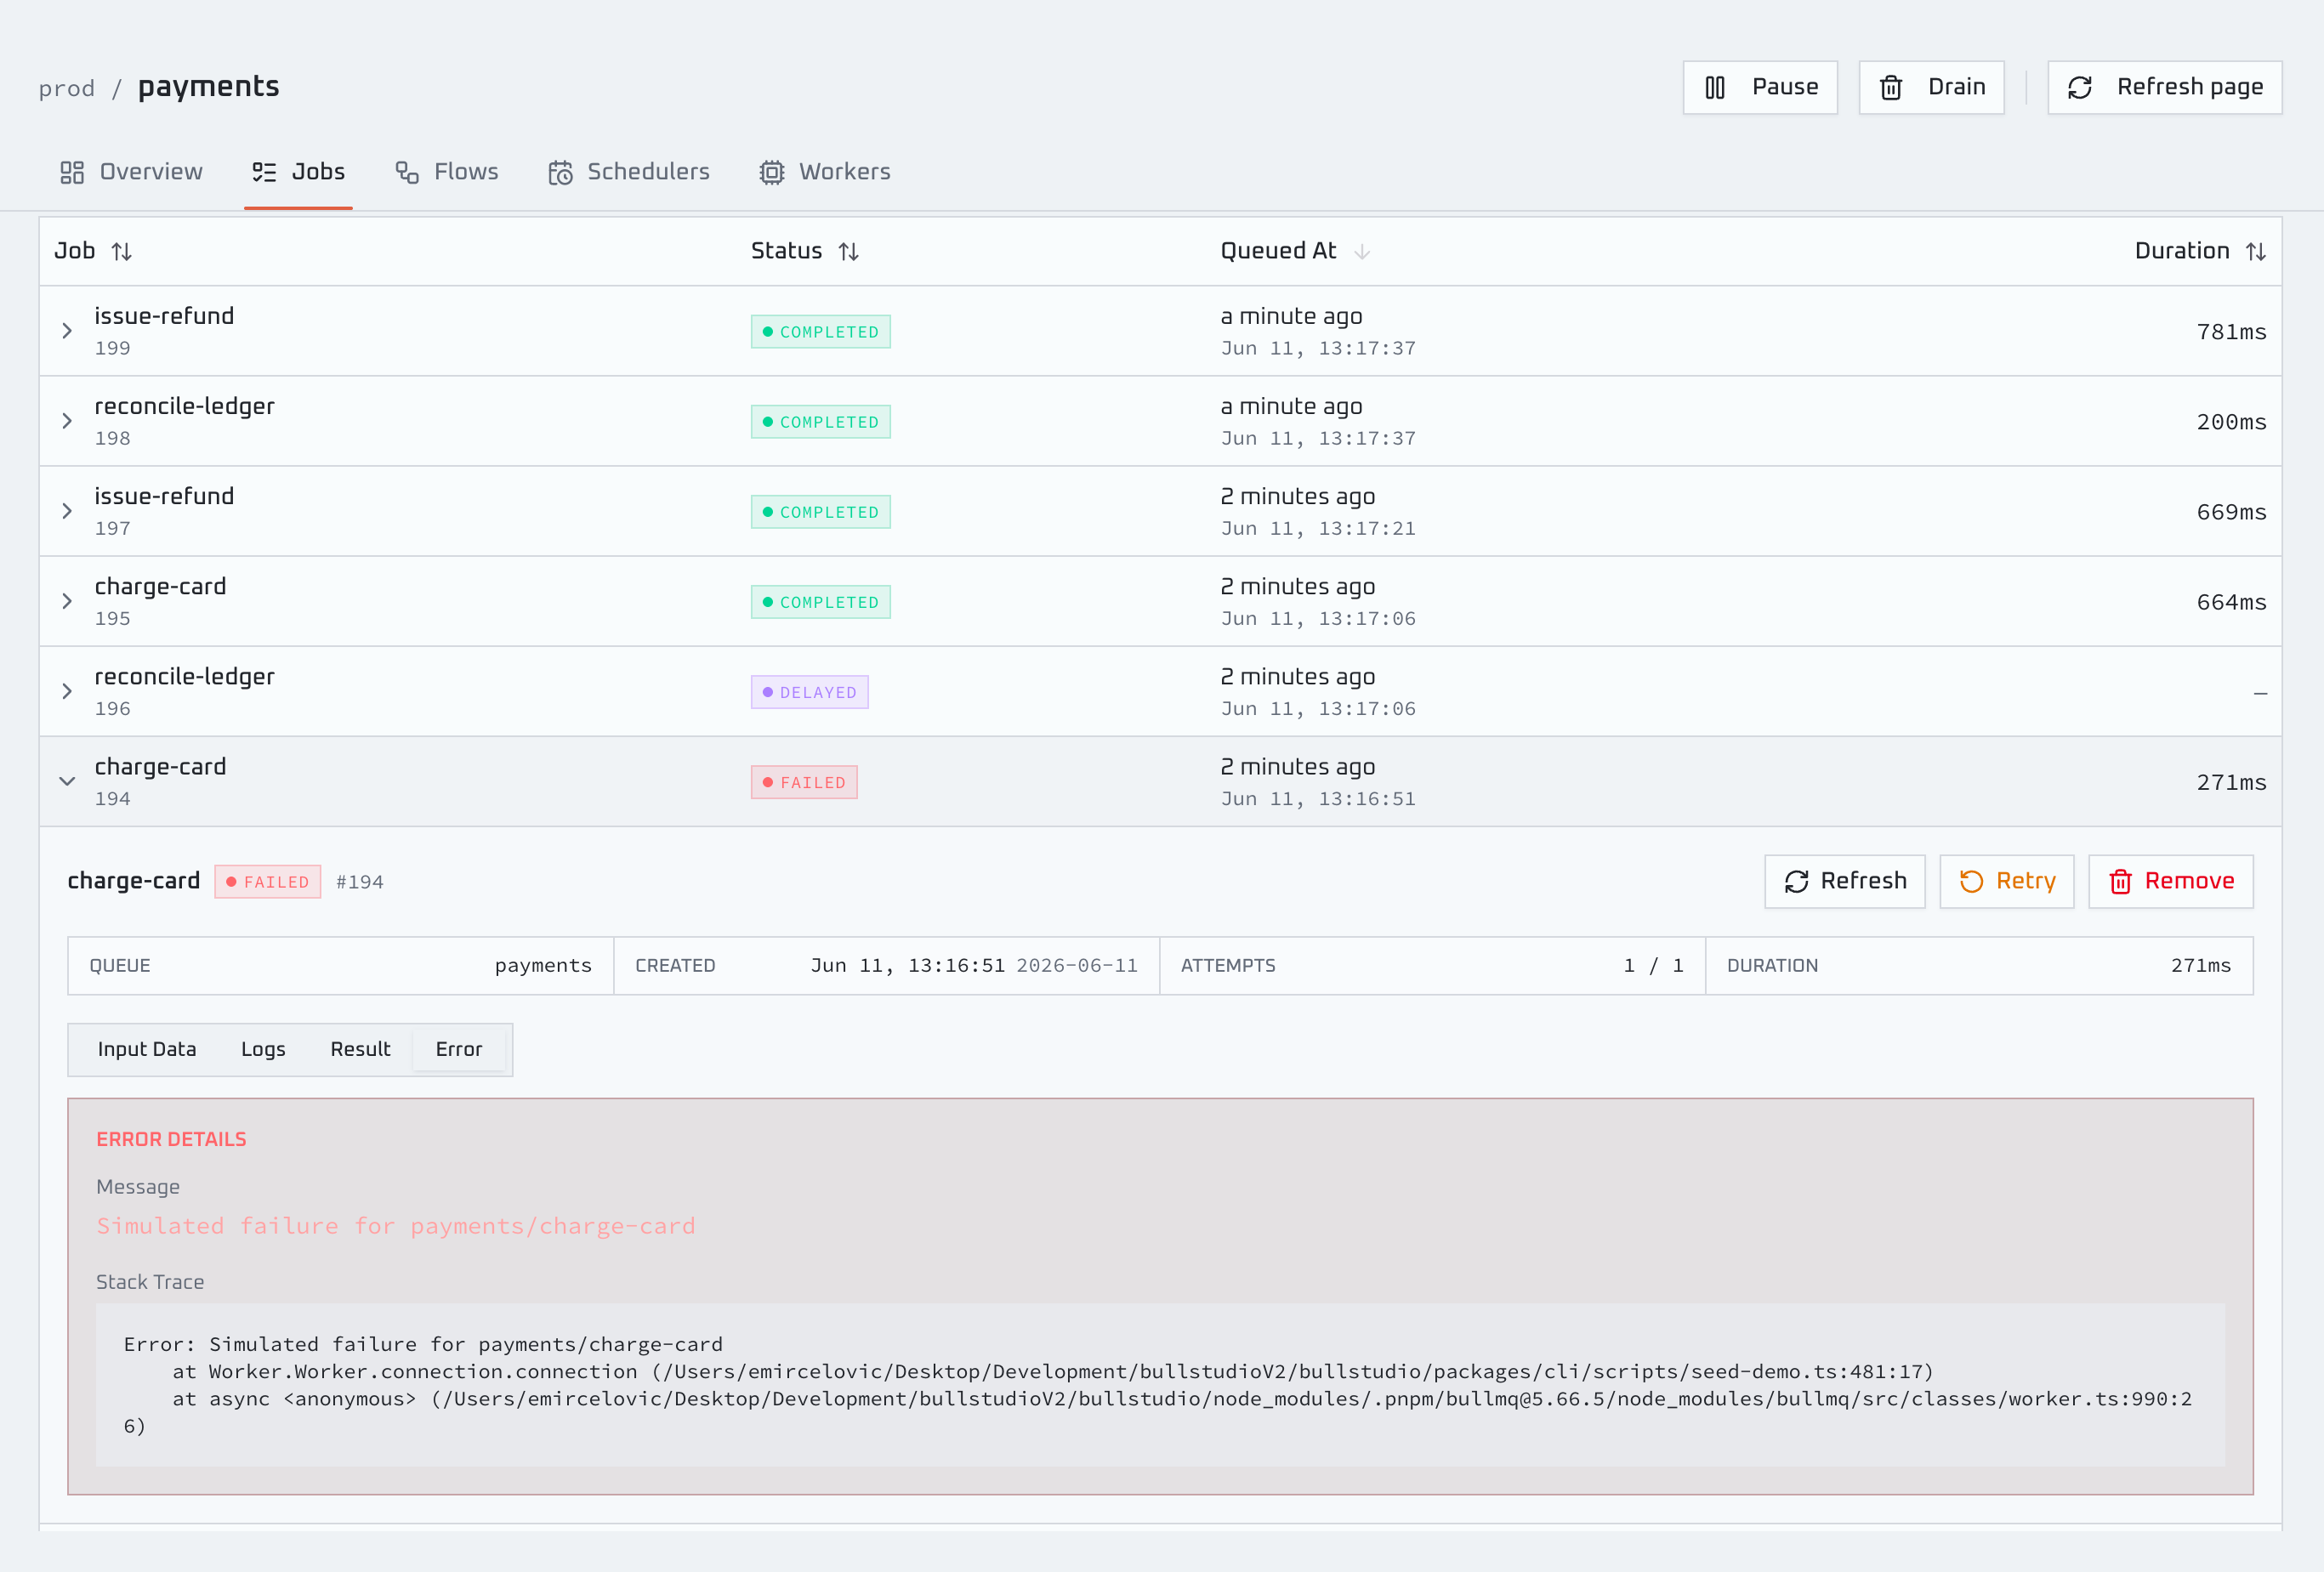
Filter by state, search by name or id, and open any job to read its data, logs, return value and stack trace. Retry or remove in one click.
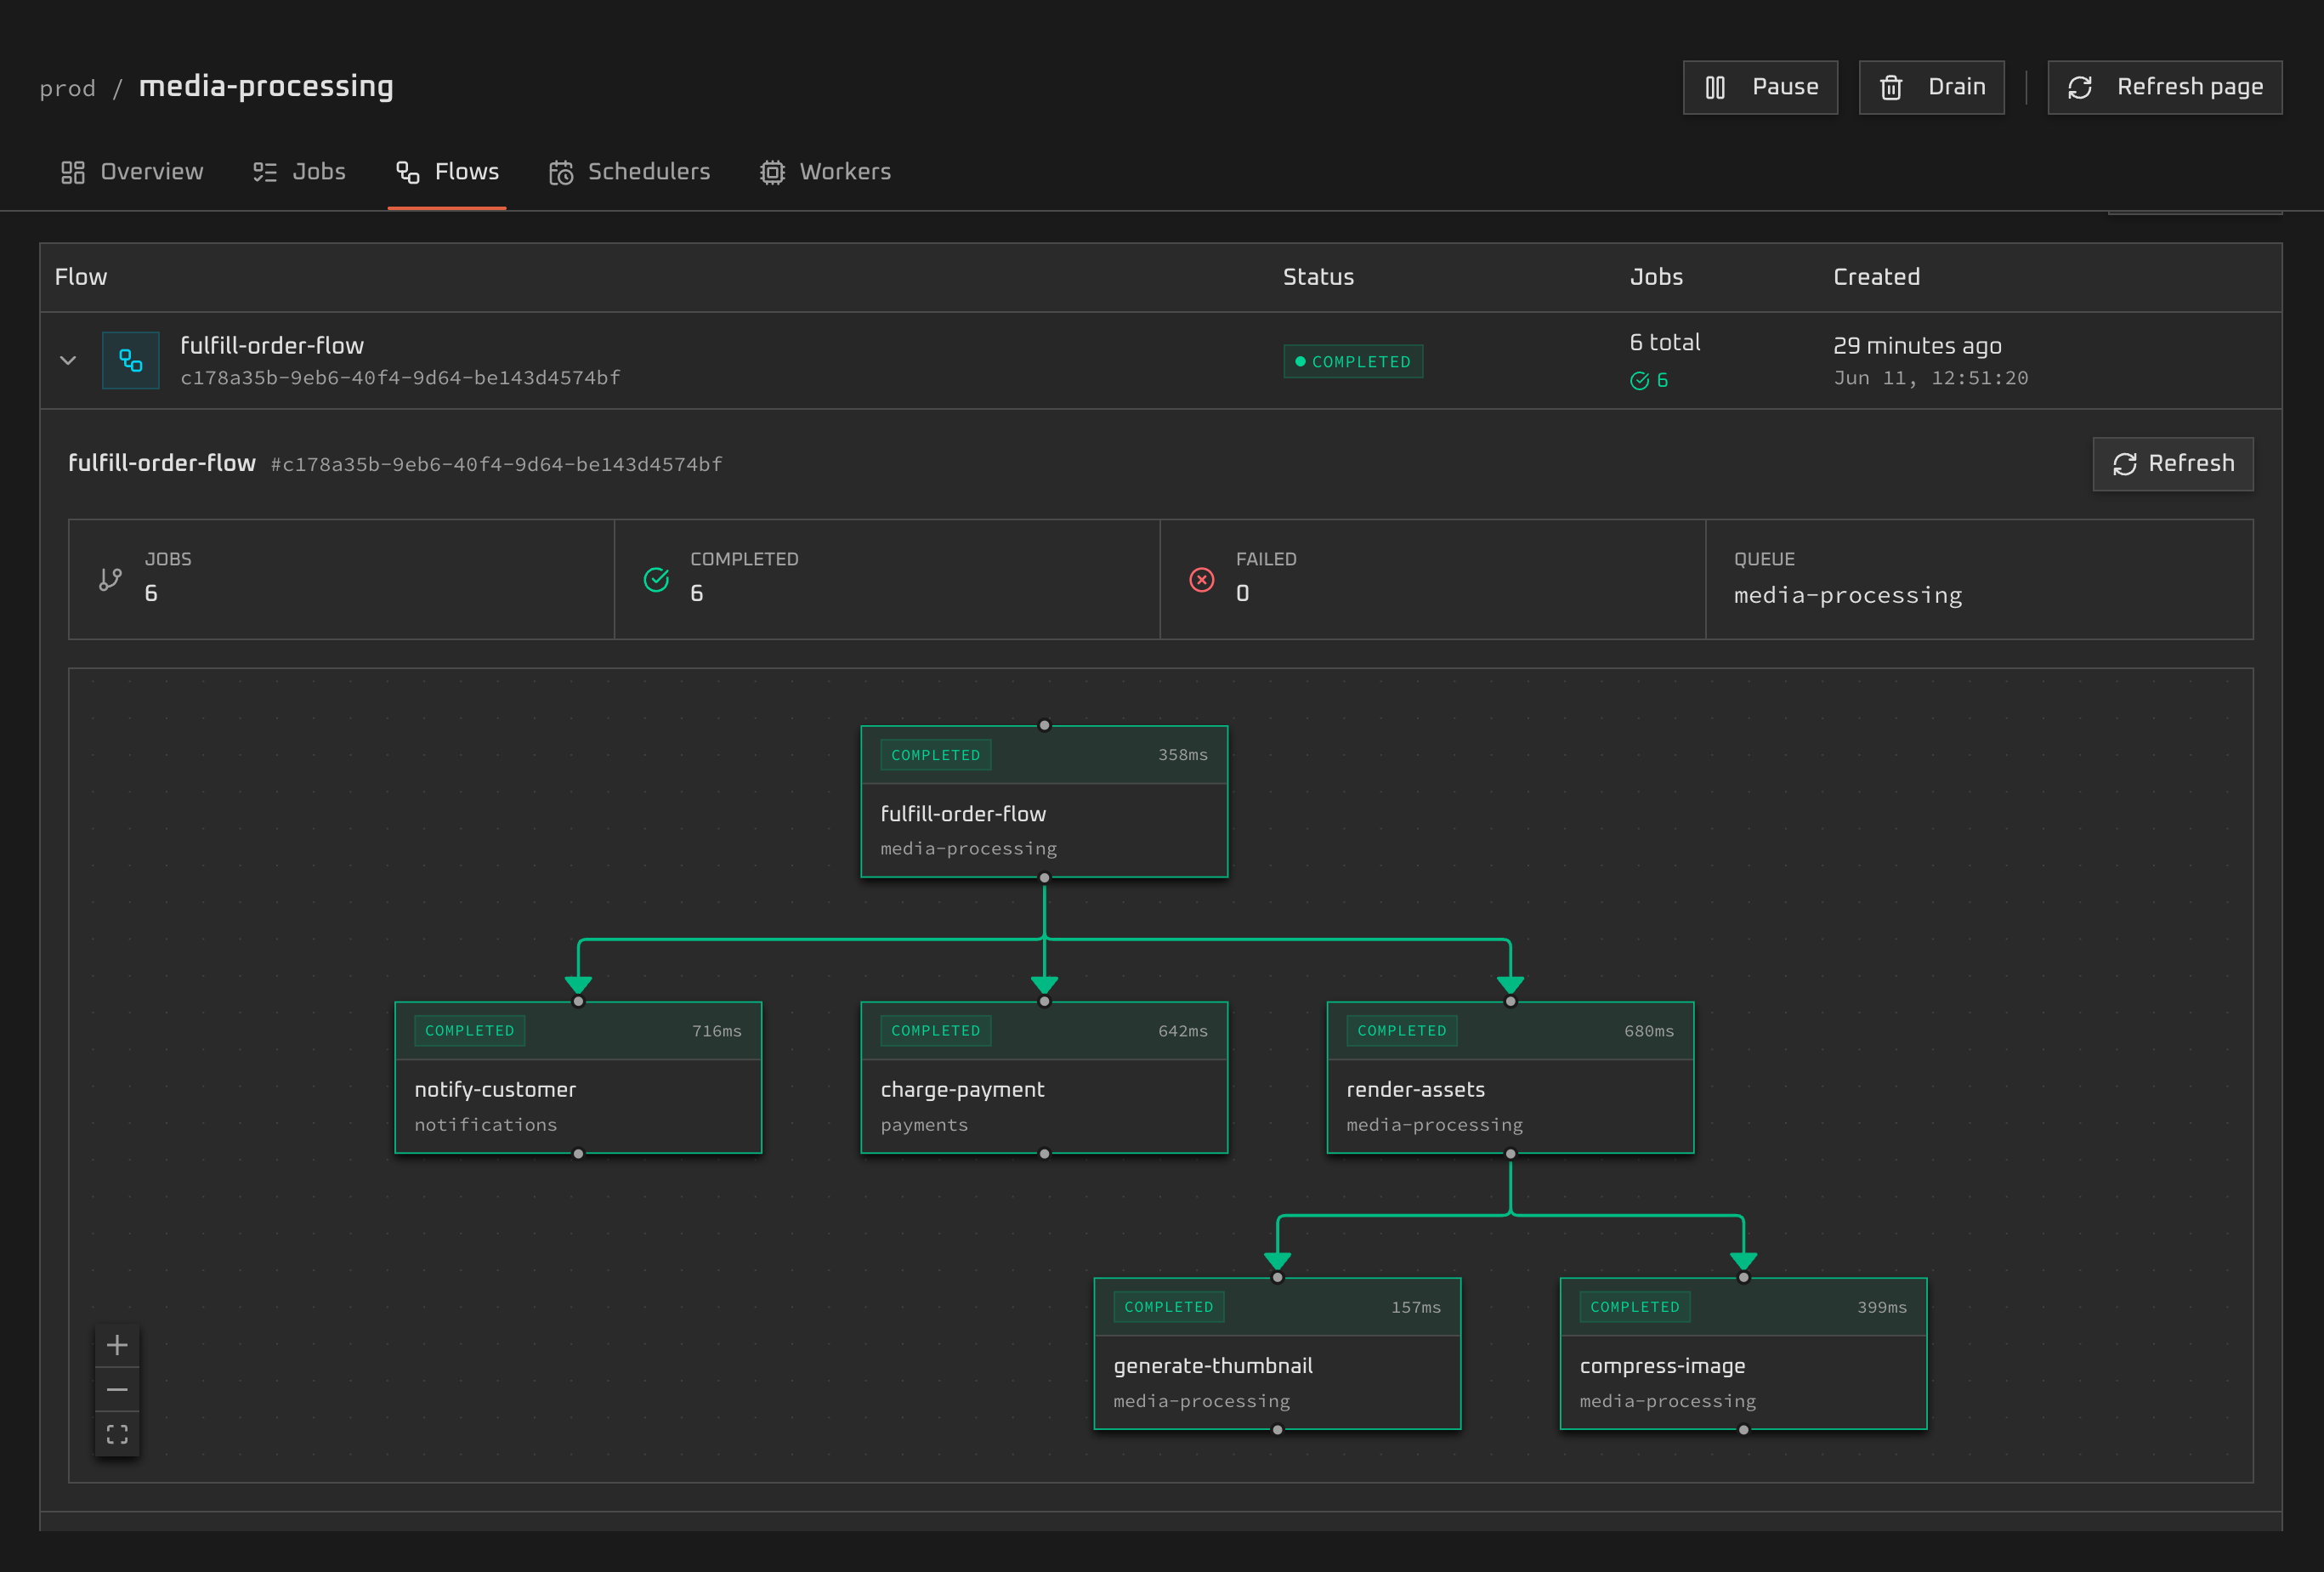
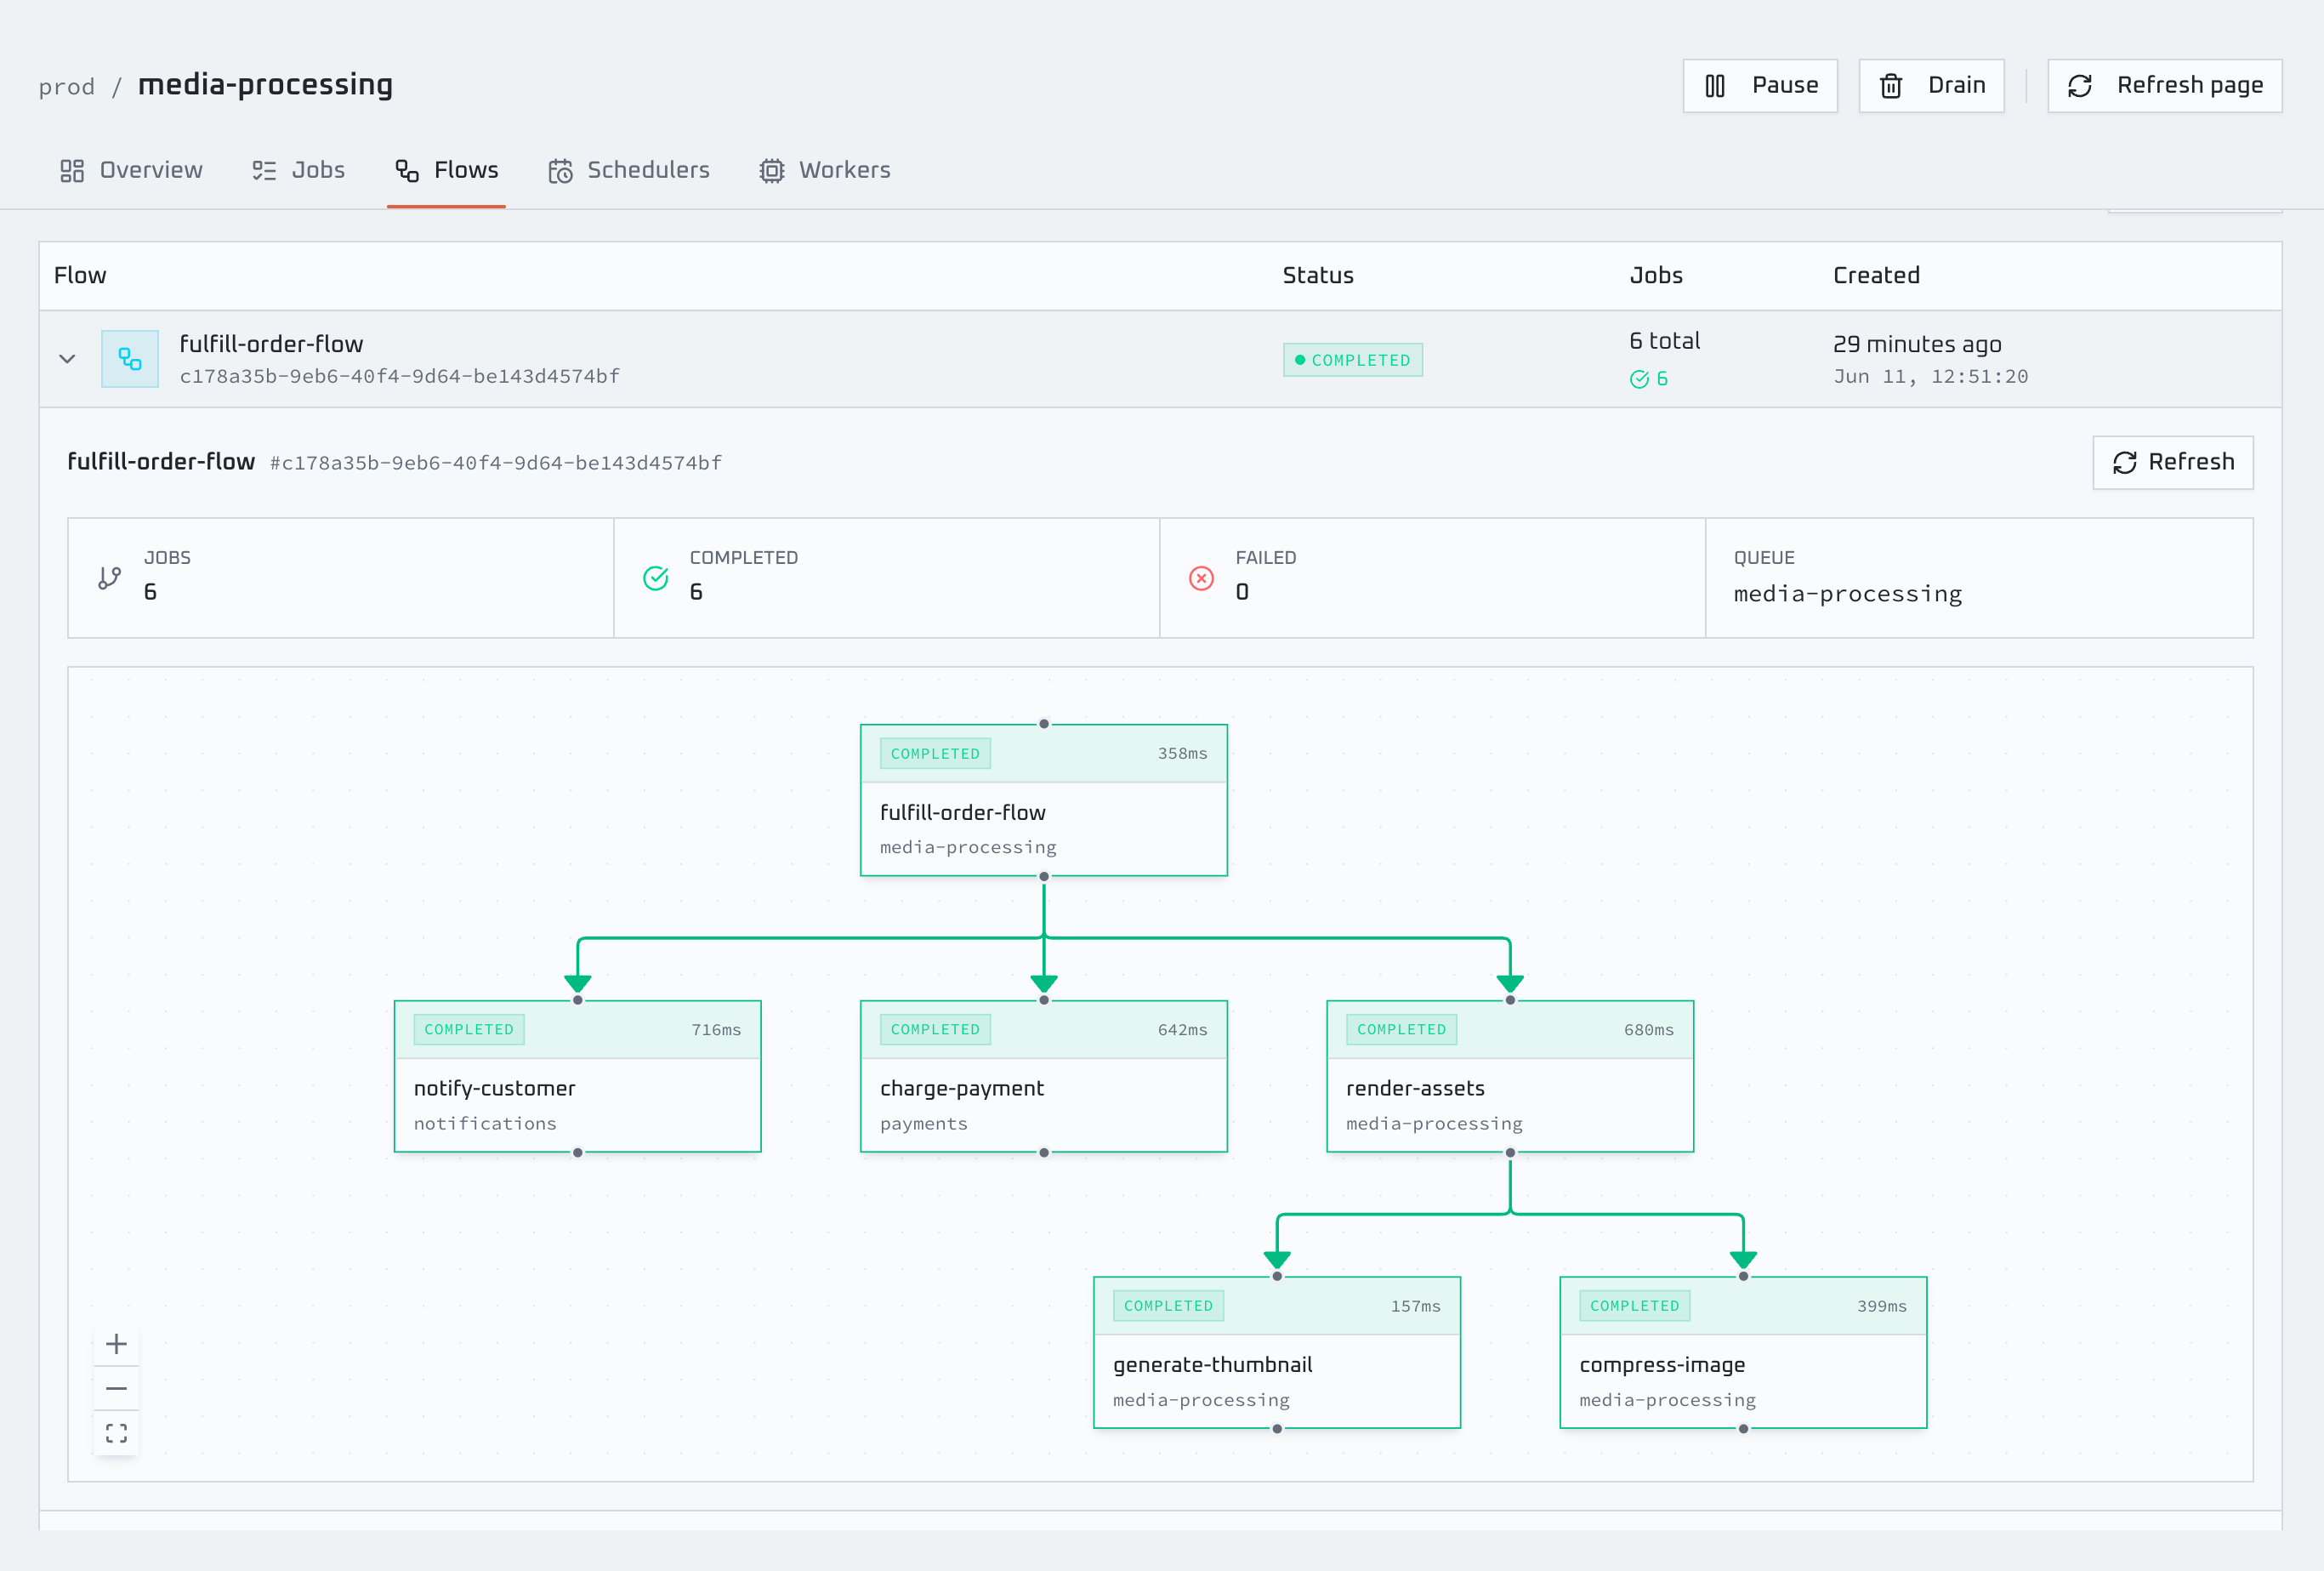
Visualise BullMQ parent/child flows as a live dependency graph, color-coded by state, so you can trace exactly where a flow stalled.
Jobs, workers, schedulers, flows — each gets a purpose-built screen instead of a wall of raw Redis keys.
Browse every job by state, search by name or id, and open one to inspect its payload, logs, return value and stack trace. Retry, promote or remove without a Redis CLI.
See every connected worker live — what it's processing right now, its concurrency and last heartbeat — so you know whether work is moving or stuck.
Read every repeatable and cron-scheduled job in one place, with the pattern and next run time spelled out. Add or remove a schedule on the spot.
Follow BullMQ parent/child flows as a live dependency graph, color-coded by state, so you can trace exactly where a multi-step job stalled.
Pause, resume, drain or clean any queue, and watch waiting, active, delayed and failed counts update in real time across the whole connection. Supports multi-prefix setups.
Throughput, failure rate, processing time and backlog trended over time — the at-a-glance health read that turns guesswork into a number.
Discover everything on a Redis connection, or mount a scoped dashboard inside the app you already ship to production.
Point it at Redis.
Run Bullstudio as its own process — from your laptop or a container — and let it discover every queue on the connection. No code, no integration.
Mount it where your app lives.
Mount a dashboard instance inside your existing Hono, Express, Fastify or Next.js app. Expose only the queues you supply — optionally read-only and behind Basic Auth.
Bullstudio ships native adapters for the major Node frameworks. Pick yours — the snippet is copy-and-run.
npx bullstudio -r redis://localhost:6379docker run -p 4000:4000 emirce/bullstudio -r redis://host.docker.internal:6379No code. Point it at Redis and Bullstudio discovers your queues — it auto-detects whether they are Bull or BullMQ. The dashboard opens at localhost:4000.
Nothing to wire up. The standalone CLI is the whole integration.
One command to a running dashboard. No account, no telemetry, no second service.
npx bullstudio -r redis://localhost:6379